FaCeT
Protected Areas
Protected areas form the backbone of global conservation strategies. For many seabird and marine species, protected areas serve as critical refuges and food sources. At the same time, there are growing concerns as to whether protected areas will continue to afford protection to populations of marine animals and their habitats under climate change.
Marine Protected Areas
As climate change accelerates, marine protected areas are under increasing pressure to conserve marine life. Rising temperatures, changes in current strength, and other oceanographic shifts are altering habitats within these zones. Alterations in species migration and movement in response to changing ocean conditions present another challenge to these important areas.
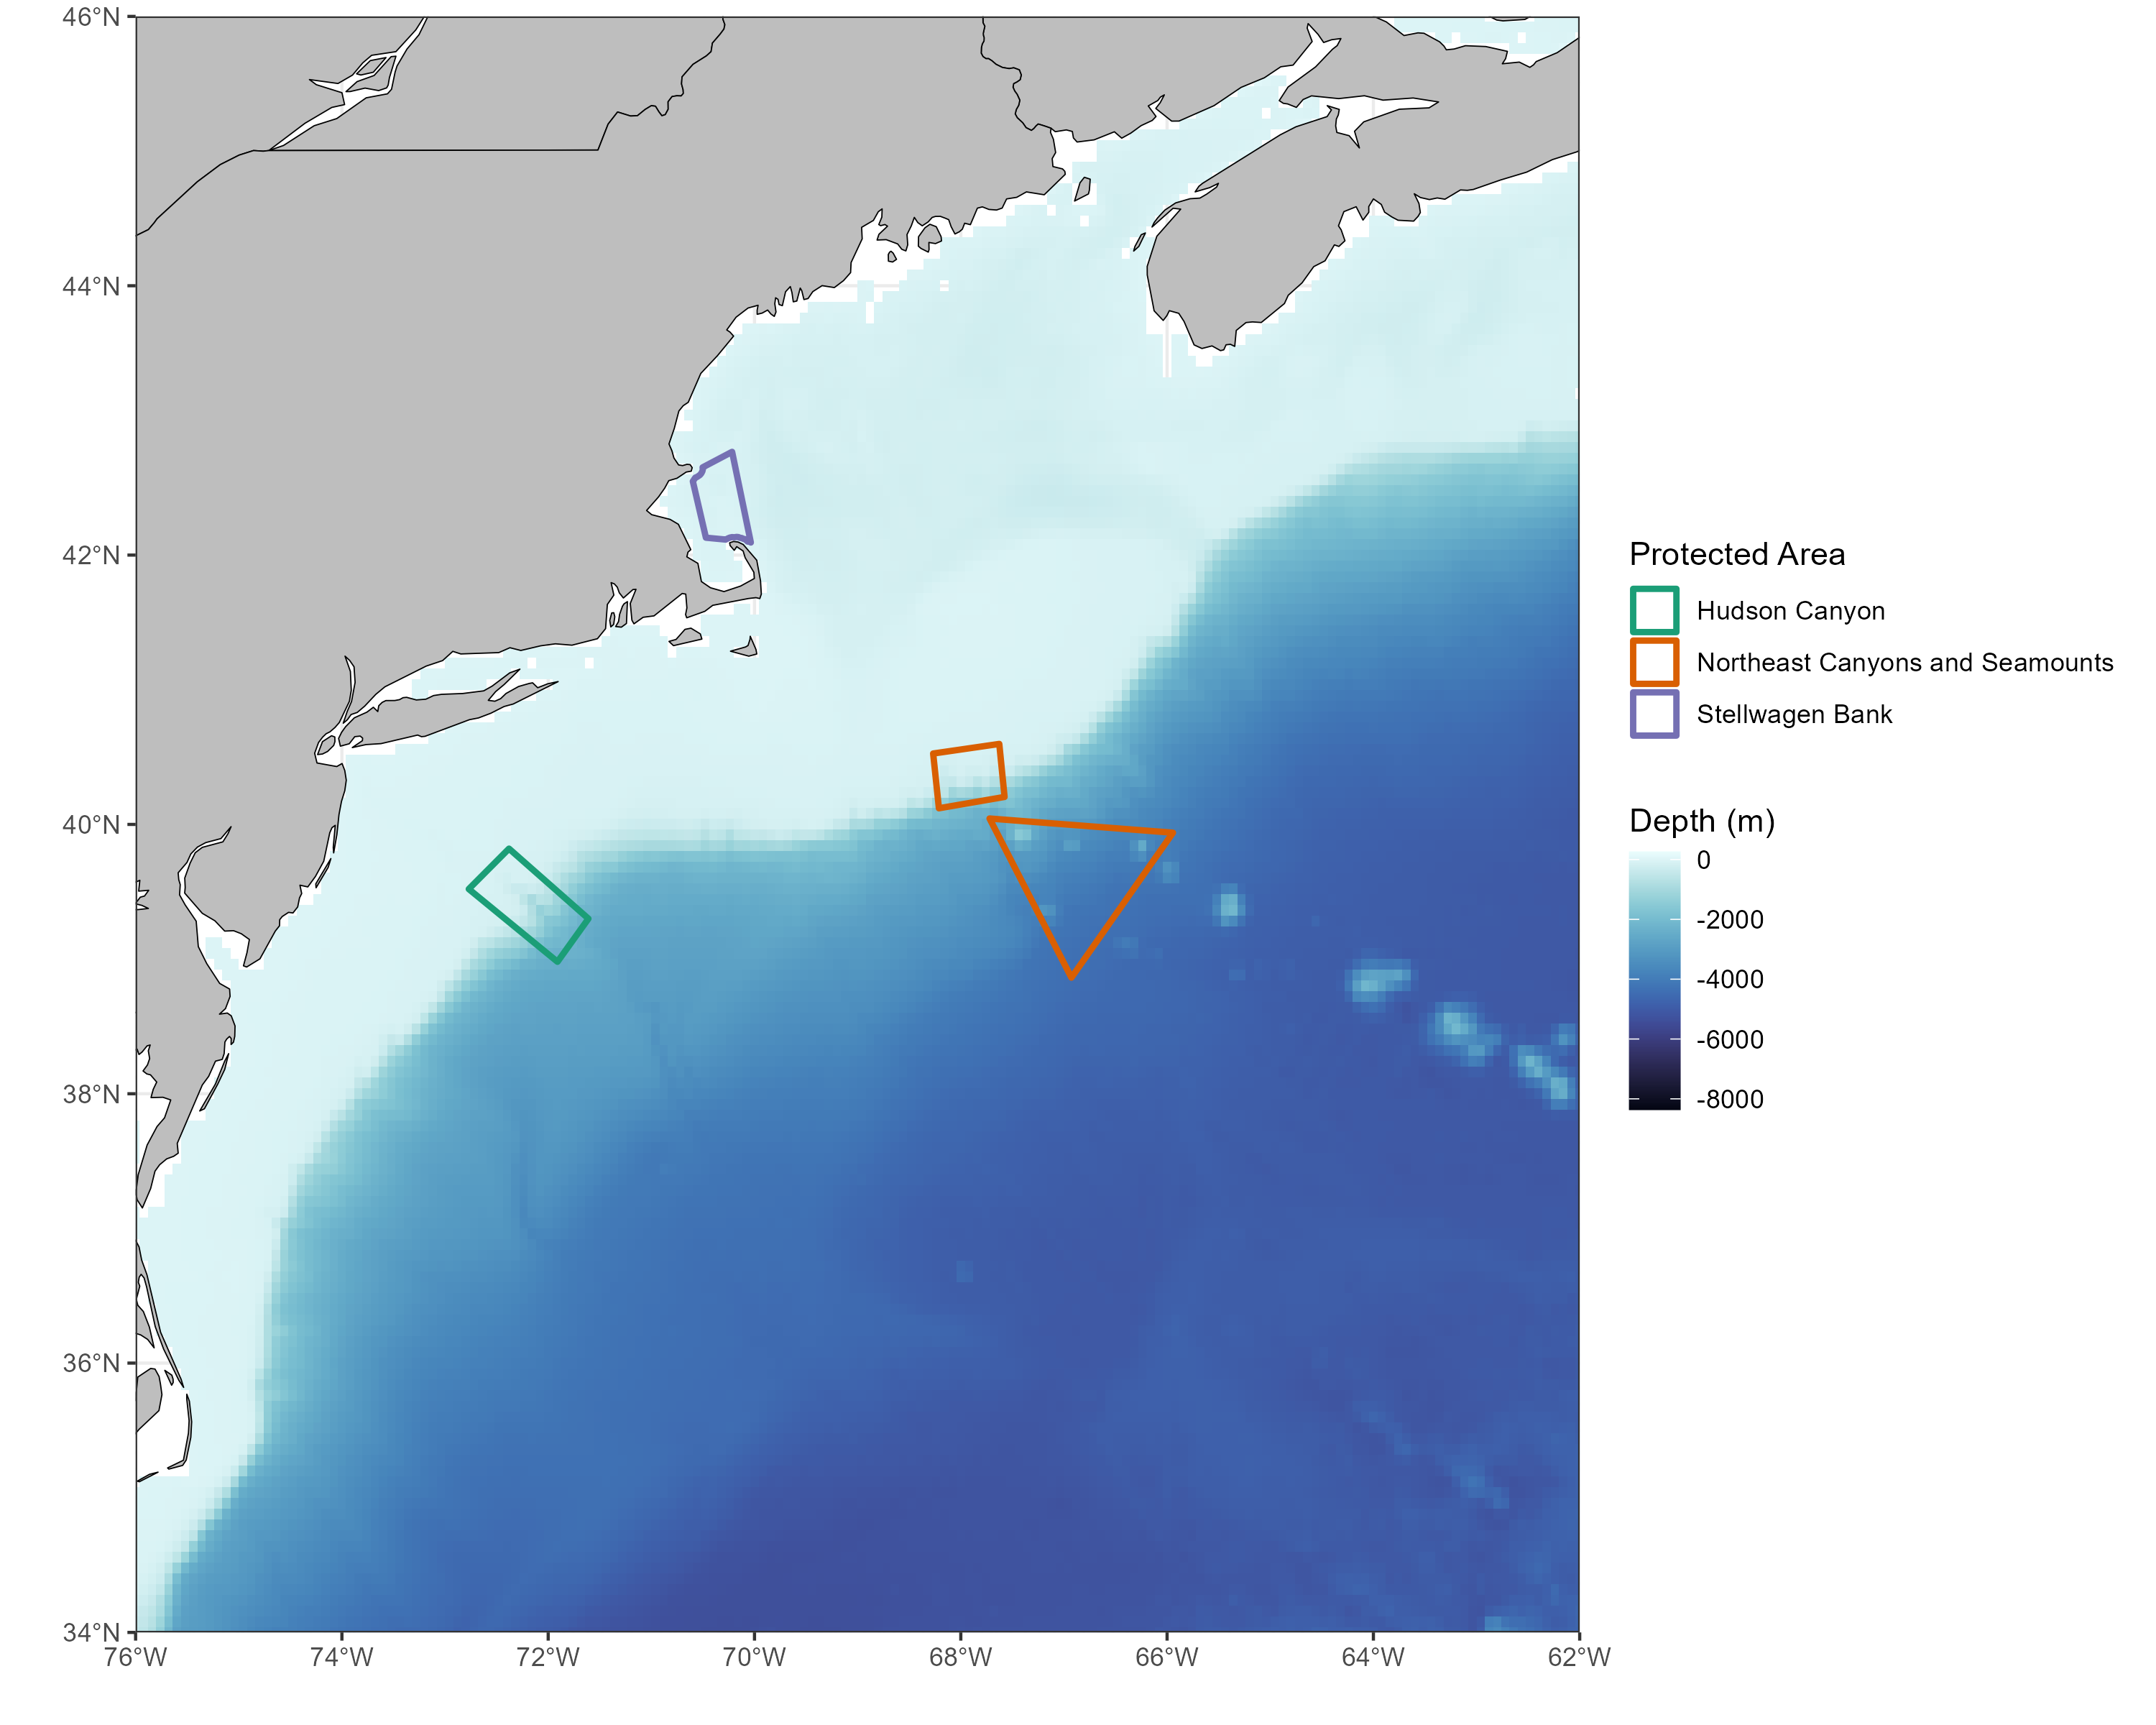
FaCeT is collaborating with personnel from three protected areas in the Northwest Atlantic: Stellwagen Bank, Northeast Canyons and Seamounts, and Hudson Canyon.

Working with team members from these protected areas, and in collaboration with the Northeast Regional Ocean Council, FaCeT is developing new data visualizations and tools to help support efforts across the areas. Our work focuses on a range of indicator species including tunas, sharks, billfish, forage fish, marine mammals, and seabirds.
Five Project Areas
FaCeT's new data visualizations and tools fall into five focus areas, and are in varying stages of development.
Track habitat change
The first two maps below compare historical (1990-1999, left map) to expected future (2090-2099, center map) habitat suitability to understand how species distributions will likely change between those time frames. Habitat gains are shown in yellow and losses are shown in blue. The change between the two timeframes is visualized in the third map on the right, where habitat gain is shown in yellow and loss is shown in maroon.
 Open the image full screen.
Characterize changes in species phenology/timing
This project is in the early stages of development. We look forward to sharing our progress with you.
Describe refugial capacity for each area
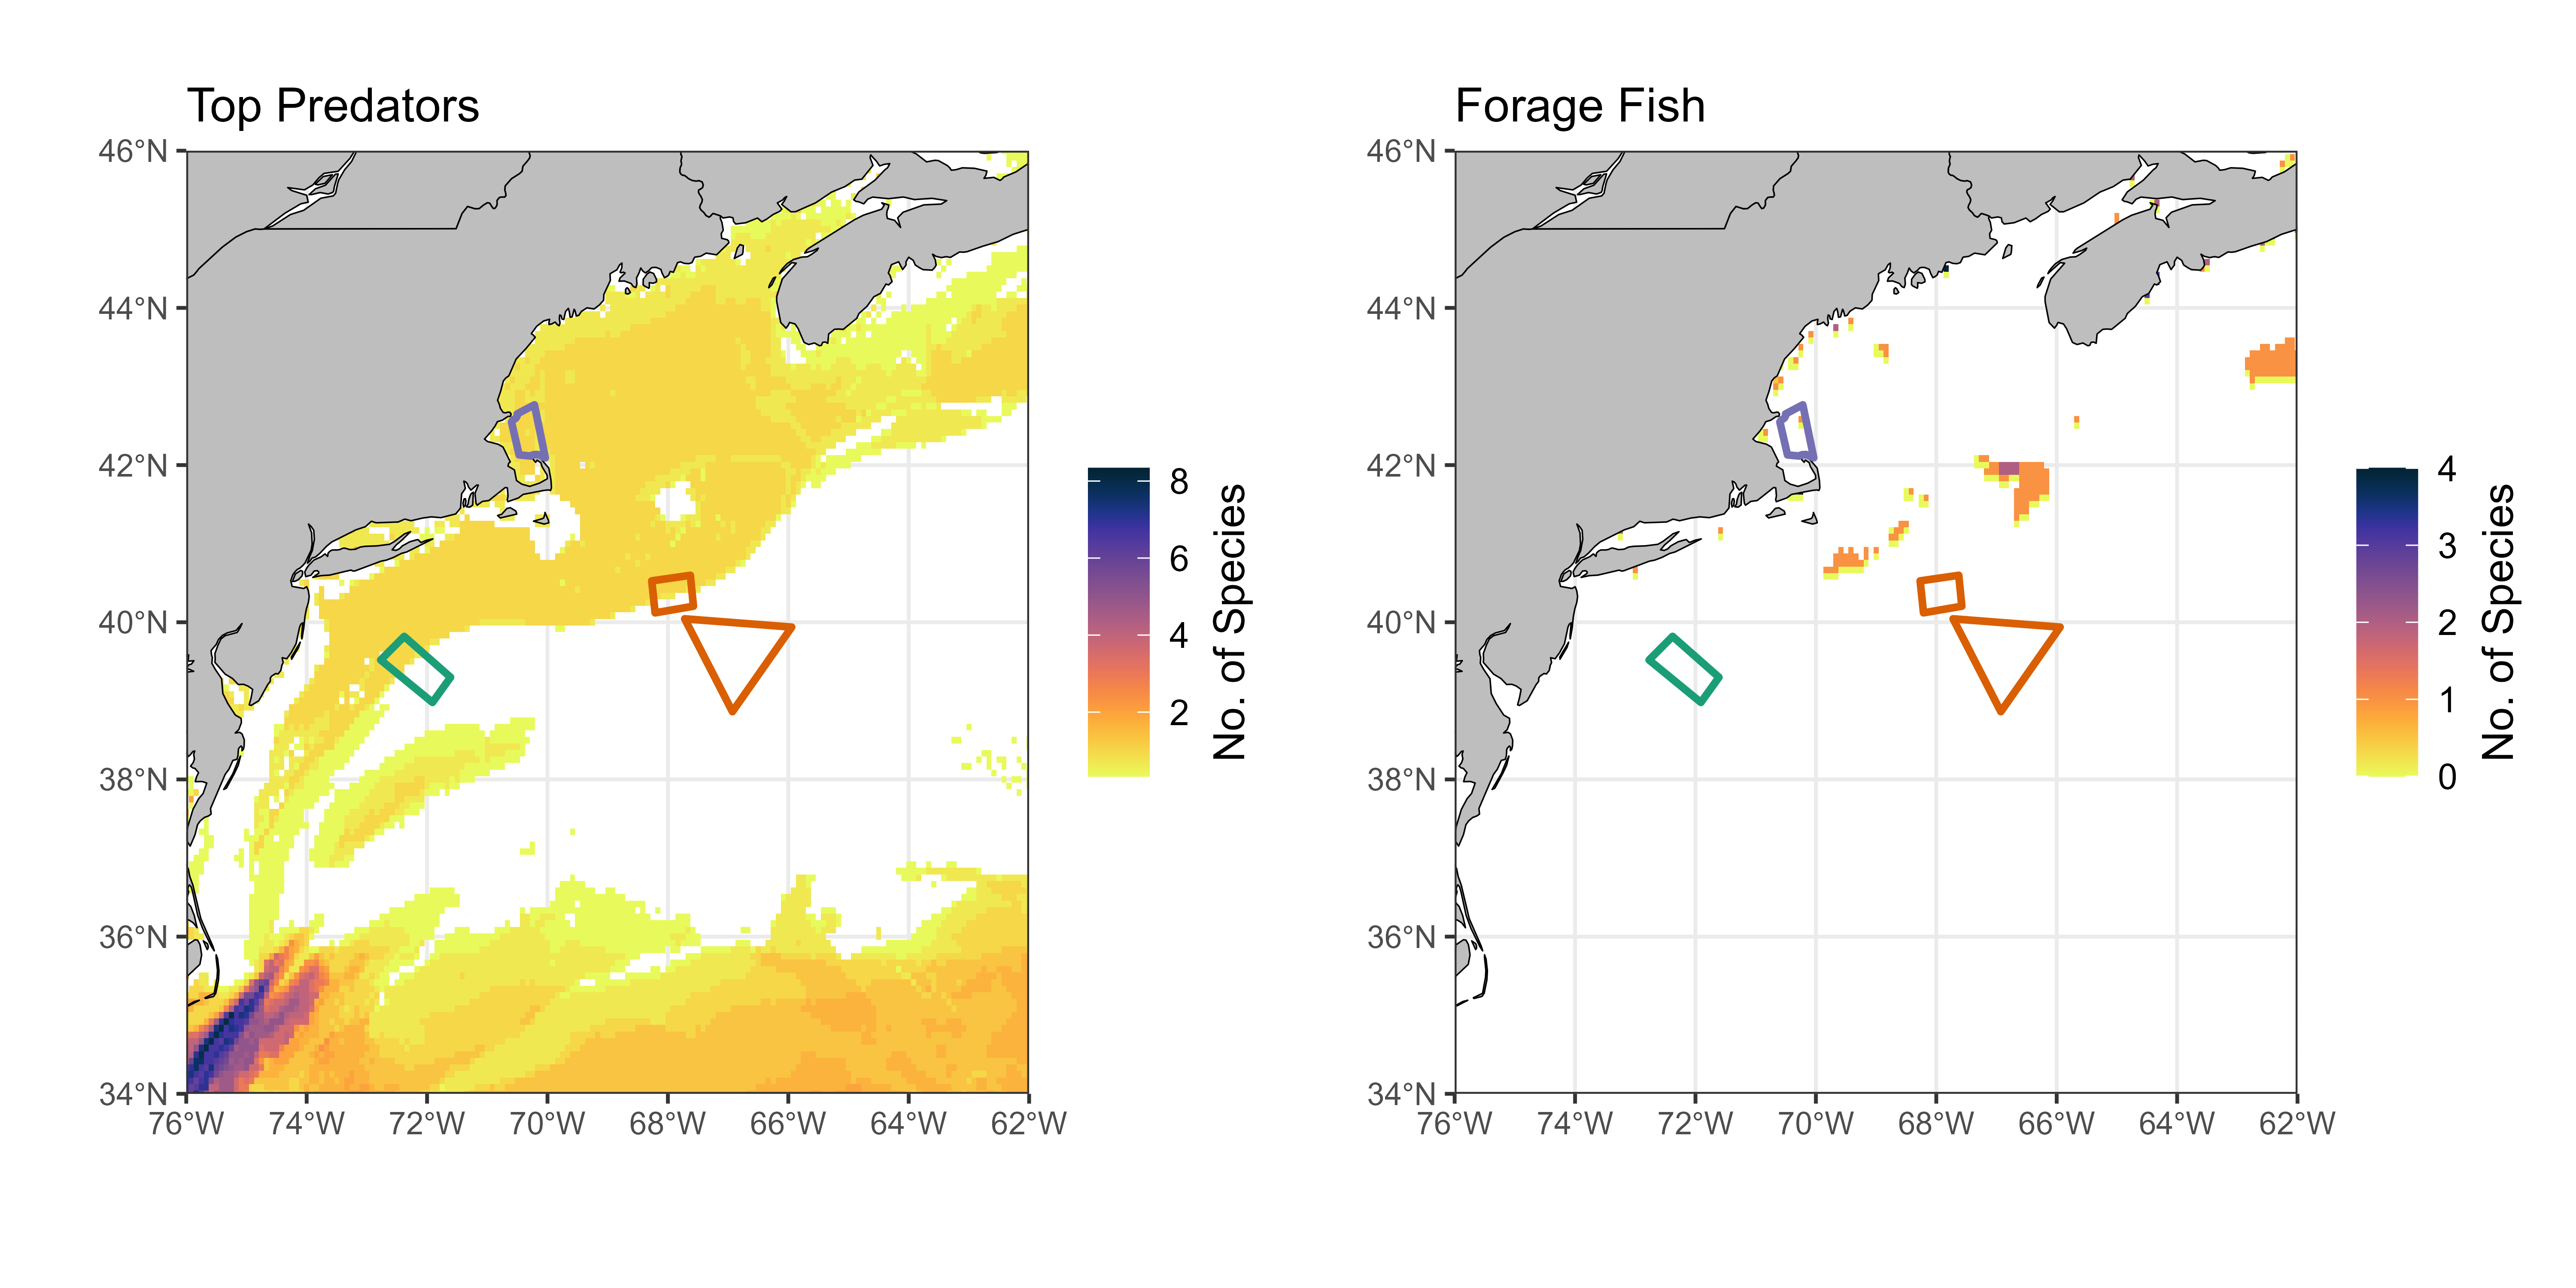
Here, we are identifying the refugial capacity within and around marine protected areas in the Northwest Atlantic, where darker colors indicate the number of top marine predator species (specifically among tunas, sharks, and billfish) and forage fish (Atlantic mackerel, Atlantic herring, sand lance, and menhaden) that will lose habitat.
 Open the image full screen.
Map the intensity of marine heatwaves
Marine heatwaves (MHWs) are episodic ocean warming events that alter regional oceanographic processes and can lead to cascading impacts on socio-ecological systems.
To track their impacts, the intensity of MHWs, represented as sea surface temperature anomaly (°C) in the map below, and their spatial extent (white contours) will be detected for the Northwest Atlantic region where the three protected areas are located.
 Open the image full screen.
Identify marine heatwave frequency
As we document the intensity of MHWs, we are also identifying their frequency in each of the protected areas to better understand which areas are more heavily impacted.
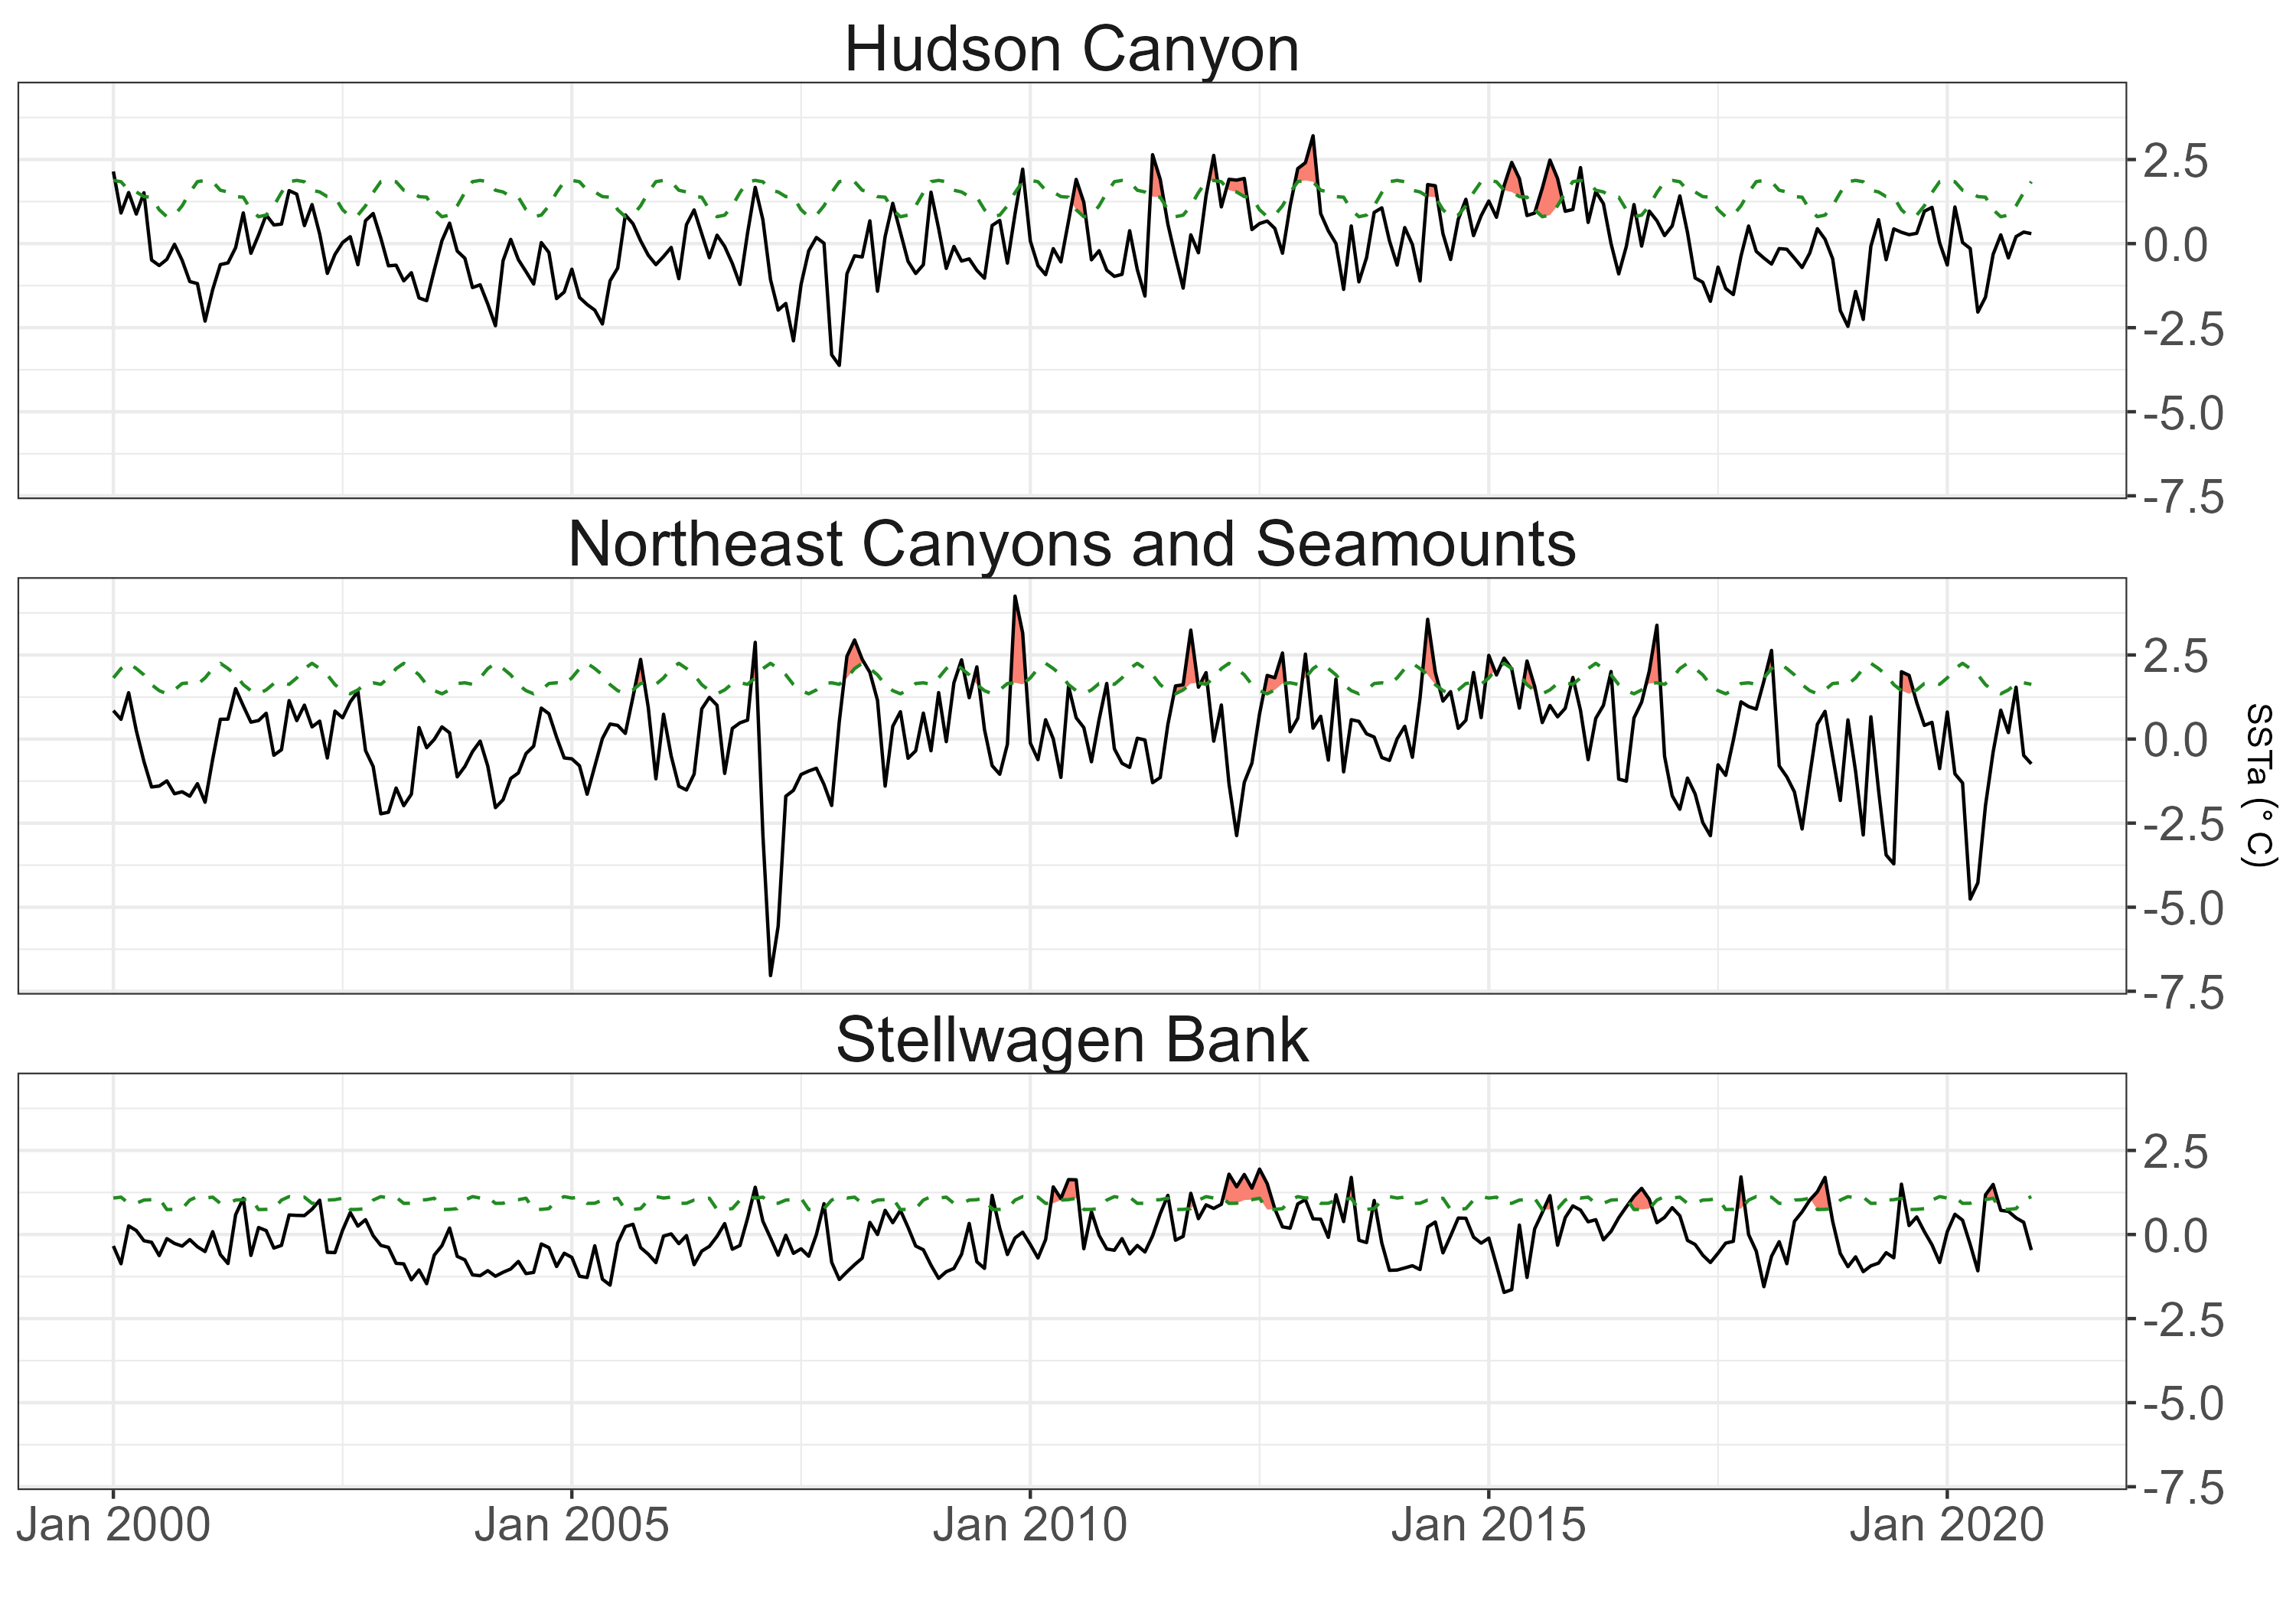
The following set of time series charts show sea surface temperature anomalies (SSTa, black lines) within each protected area. Periods classified as a marine heatwave are shown as red shading. The seasonally varying 90th percentile threshold, which defines MHWs, in each protected area is shown as green dashed lines.
 Open the image full screen.
Warming Waters and Species Survival
Due to the likely limited capacity of MPAs to serve as refuges for marine species in the future, FaCeT is particularly interested in how marine heatwaves and other climate impacts may affect species survival. For example, some of our findings show predicted changes in the range and/or population sizes of specific species as they adapt to warming waters.
Learn more about our research in these areas:
US Marine Protected Areas Dashboard
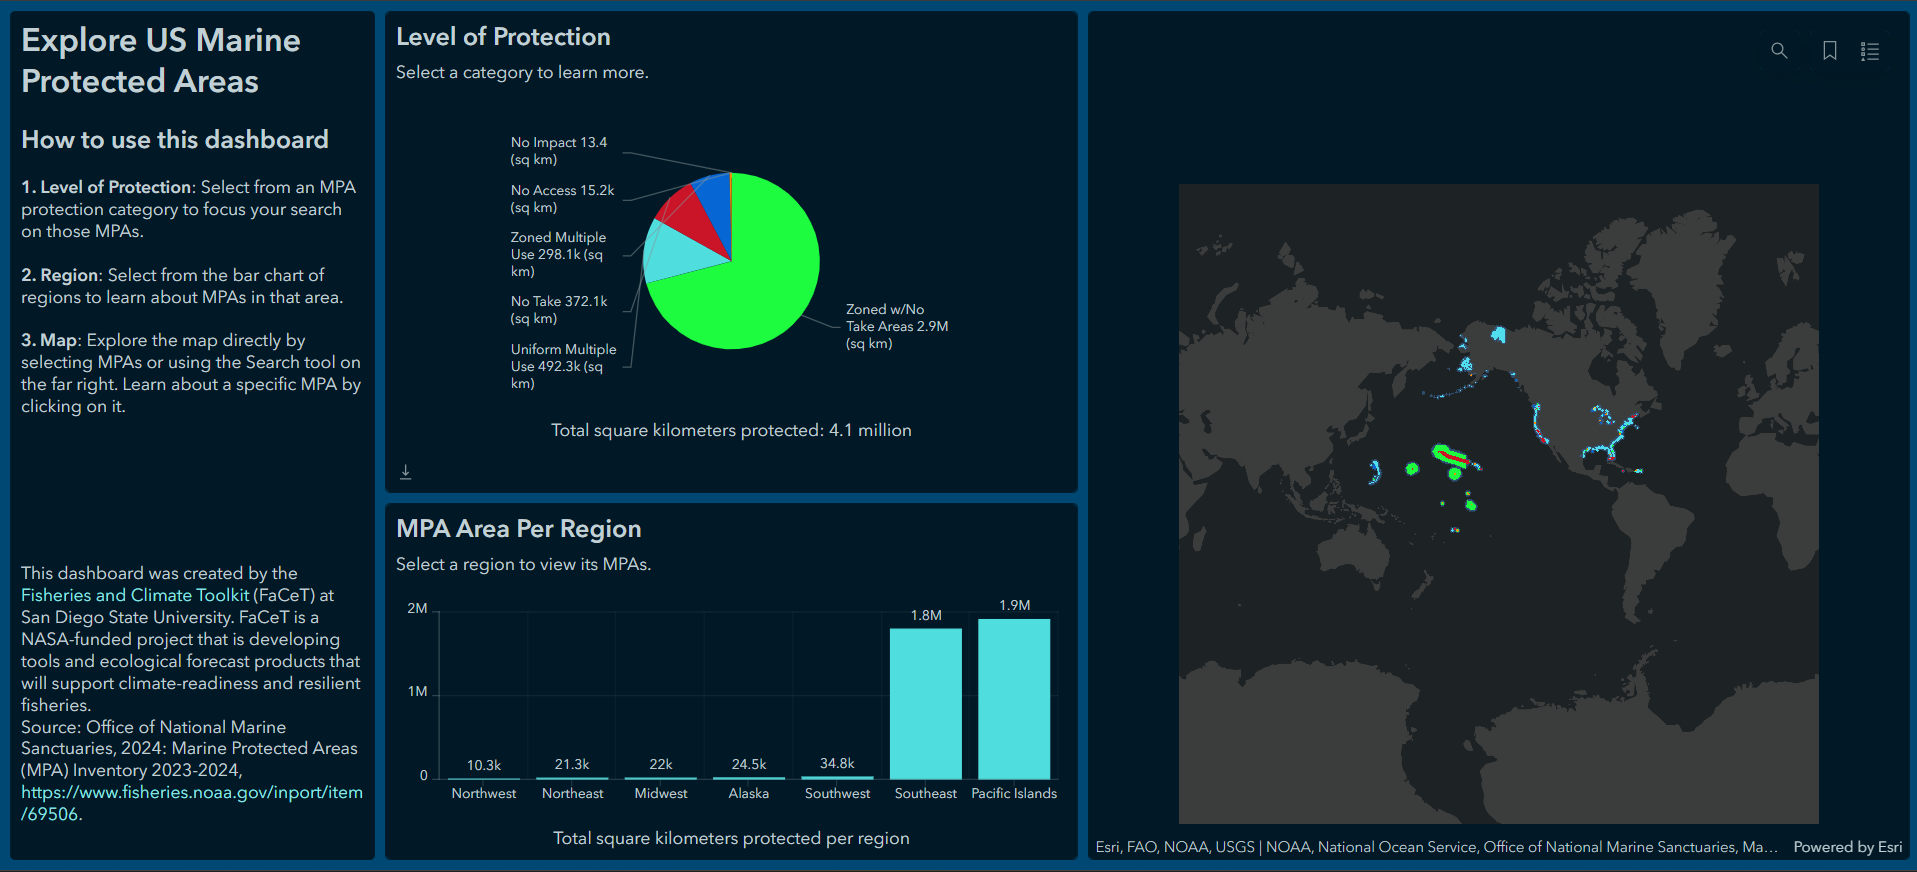
Explore our US Marine Protected Areas Dashboard to learn more about MPA locations, regional distribution, and individual protections.


